Pop Report Deep Dive: What Actually Grades a 10 (Real Numbers from 30,490 Cards)
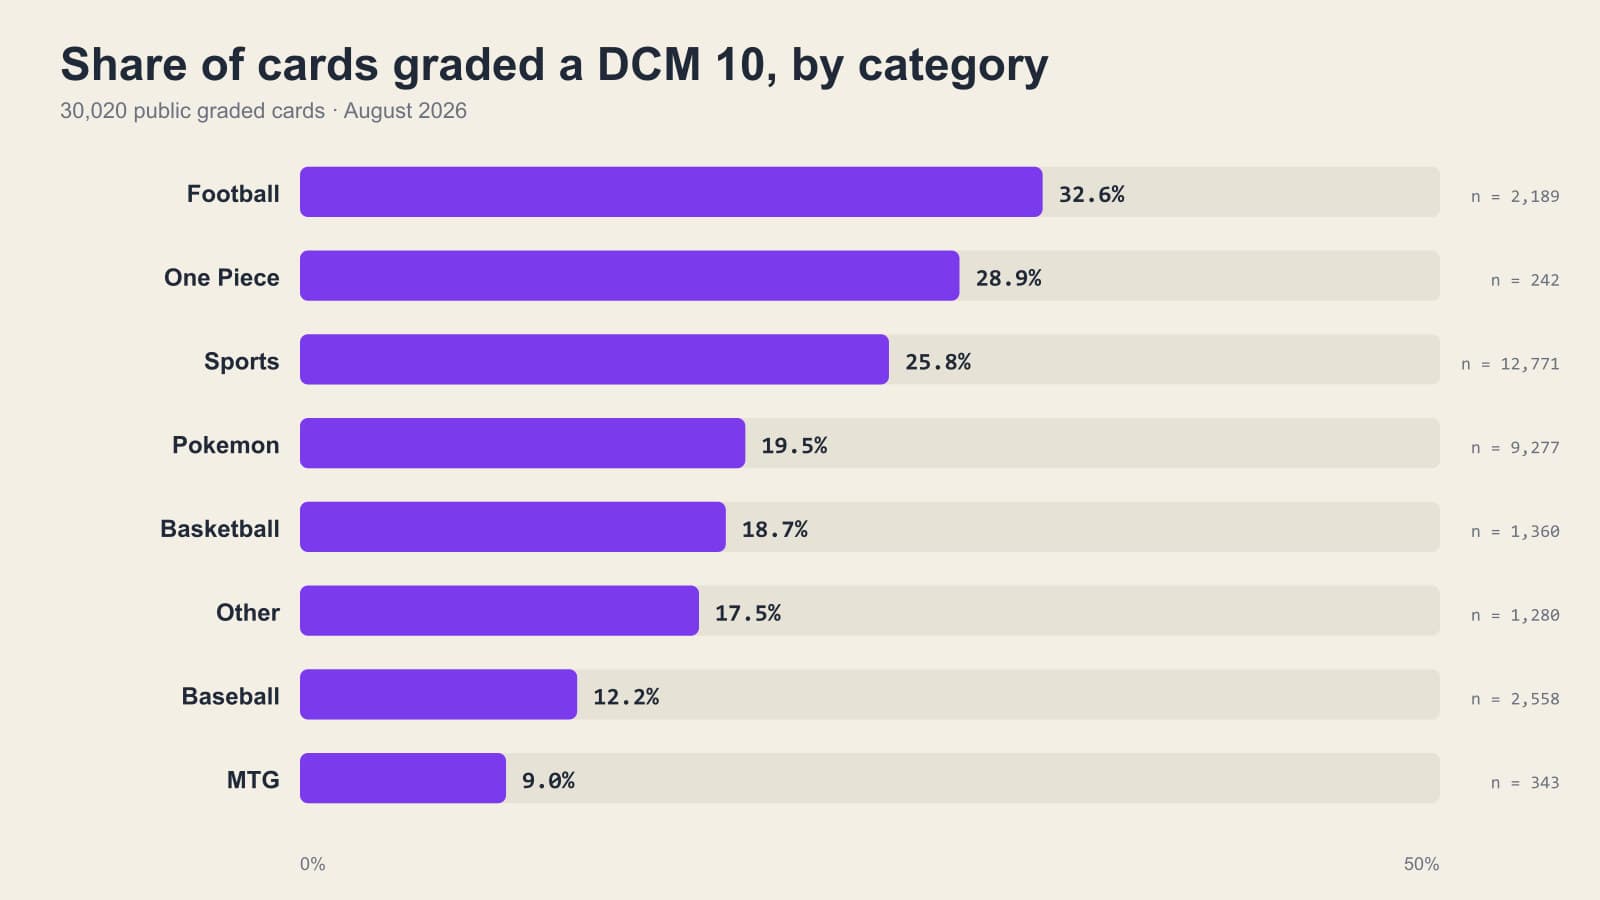
Bar chart of the share of cards graded a DCM 10 by category, with football highest and Magic the Gathering lowest
Which categories earn Gem Mint most often, where the 9s pile up, and what it means for the cards in your binder.
Quick answer
Across 30,490 public cards graded on DCM as of August 2026, 22.3 percent graded a 10 and 44.6 percent graded a 9. The 10 rate ranges from 32.6 percent for football down to 9.0 percent for Magic: The Gathering, driven mostly by card stock: modern chrome and Prizm resist handling wear, while softer or foil-heavy stock loses corners and surface faster.
Everyone in the hobby has a feeling about how hard a 10 is to get. Here are the actual numbers from every public card graded on DCM, 30,490 of them as of August 2026.
The headline
22.3% of cards graded a 10. 44.6% graded a 9. Put together, 66.9% of cards landed at 9 or 10, and 33.1% landed at 8 or below.
 Bar chart of all DCM grades from 1 to 10 showing the largest share at 9, the second largest at 10, and a long tail down to 1
That shape, a big peak at 9 with the 10s next to it and a long tail below, is what you would expect from cards that collectors chose to grade. Nobody photographs their beat-up commons. The cards that get graded are the ones their owners already thought were good, and most of them are, which is exactly why the difference between a 9 and a 10 matters so much.
By category
The 10 rate is not the same everywhere. Here are the categories with at least 200 graded cards.
 Bar chart of the share of cards graded a DCM 10 by category: football, One Piece, sports overall, Pokemon, basketball, other, baseball, and Magic the Gathering
| Category | Cards | Graded 10 | Graded 9 |
|---|---|---|---|
| Football | 2,189 | 32.6% | 47.2% |
| One Piece | 242 | 28.9% | 52.9% |
| Sports | 12,771 | 25.8% | 40.0% |
| Pokemon | 9,277 | 19.5% | 52.3% |
| Basketball | 1,360 | 18.7% | 47.6% |
| Other | 1,280 | 17.5% | 43.3% |
| Baseball | 2,558 | 12.2% | 35.5% |
| MTG | 343 | 9.0% | 40.5% |
What drives the spread
Modern chrome and Prizm stock grades high. Football at 32.6% is the top of the table, and it is dominated by recent Prizm, Select and Chrome. These cards come out of the pack with sharp corners and a hard gloss that resists the handling that whitens softer stock. Centering is the usual reason one misses.
Pokemon sits in the middle. 19.5% of Pokemon cards graded a 10, but 52.3% graded a 9, the highest 9 share of any large category. Pokemon borders are unforgiving. The yellow frame on an English card shows every bit of edge whitening, and the print runs are large enough that centering varies pack to pack. Most Pokemon 9s are 9s on centering or edges with a perfect surface.
Baseball and vintage grade lower. Baseball at 12.2% carries a lot of older cardboard. Rough cuts, soft corners and off-centre printing were normal in the 1980s and before, and a card that has survived forty years in a shoebox has usually been touched.
Magic is the hardest 10 on the table. 9.0%. Black-bordered Magic cards show edge wear the way Pokemon shows it, the older sets were cut loosely, and a lot of Magic cards were played before anyone thought to sleeve them.
What it means for your binder
- If you collect modern football or basketball, a clean card from the pack has roughly a one in three chance of a 10. Grade the ones with good centering; that is the factor that decides it.
- If you collect Pokemon, expect a 9 more often than a 10, and check the edges on the back before you decide a card is a 10 candidate. The four defects post shows what to look for.
- If you collect vintage, a 7 or 8 is a good result and priced accordingly. Don't hold a 1985 card to a 2024 standard.
A note on how these grades are produced
Every card in this data was graded by DCM Optic with the same rubric: four subgrades, a final grade equal to the lowest one, and an image confidence letter. It doesn't know the card's value, it doesn't know who submitted it, and it grades card one and card thirty thousand the same way. That consistency is what makes the numbers comparable across categories.
The live version of this data, filterable by set and card, is at the pop report. Grade a card and it joins the count.
Frequently asked questions
- What percentage of cards grade a 10 on DCM?
- 22.3 percent of the 30,490 public cards graded through August 2026. Another 44.6 percent graded a 9, so two thirds of graded cards land at 9 or 10.
- Which category grades a 10 most often?
- Football, at 32.6 percent, followed by One Piece at 28.9 percent and sports overall at 25.8 percent. Magic: The Gathering is lowest at 9.0 percent.
- Why does Pokémon have so many 9s?
- 52.3 percent of Pokémon cards graded a 9, the highest 9 share of any large category. Holo and textured stock shows surface and corner wear that stops just short of Gem Mint.
- Is the pop report biased toward good cards?
- Yes, by design. Collectors grade the cards they already think are good, so the distribution peaks at 9 with a long tail below rather than spreading evenly from 1 to 10.